


Defining and Measuring the Lumpen Class in the United States: A Preliminary Analysis

MIM(Prisons) began to draft a book on the lumpen class a few years ago. We found a gap in the theoretical material on this subject and realized that our observations about this class are a unique contribution to Marxist theory. A lot of research was done, particularly on defining the lumpen class within U.$. borders, but due to competing projects and limited time, the book was put on hold. We began distributing the chapter with our research in draft form, but are not yet close to completing the book, nor do we currently have the funds or resources to print another book. As a result, we are turning to the pages of Under Lock & Key to sum up some of our key findings and further develop and apply our theory of the First World lumpen. This article is just a summary of the more extensive draft chapter on the lumpen class which is available from MIM(Prisons) upon request for, $5 or equivalent work trade.
U Can’t Sell Dope Forever
“Power is the ability to define a phenomenon and make it act in a desired manner.” - Huey P. Newton
Marxist socialism is based in the idea that humyns, as a group, can take charge of the natural and economic laws that determine their ability to meet their material needs. Taking charge does not mean that they can decide these laws, but that they can utilize them. In doing so they develop a scientific understanding of the world around them.
Under capitalism, the anarchy of production is the general rule. This is because capitalists only concern themselves with profit, while production and consumption of humyn needs is at the whim of the economic laws of capitalism. As a result people starve, wars are fought and the environment is degraded in ways that make humyn life more difficult or even impossible. Another result is that whole groups of people are excluded from the production system. Whereas in pre-class societies, a group of humyns could produce the basic food and shelter that they needed to survive, capitalism is unique in keeping large groups of people from doing so.
In the industrialized countries like the United $tates, the culture and structure of society has eliminated opportunities and knowledge to be self-sufficient. Production is done socially instead. Simplistically this might look like: one company produces bread, another produces shoes, and everyone working for each company gets paid and uses their pay to buy things from the other companies. Everyone gets what they need by being a productive member of the larger society.
The problem is that there are not enough jobs. At first this might seem like a good thing. We are so advanced that we can get all the work done for the whole group with only a portion of those people having to work. But under capitalism, if you’re not in an exploiter class, not working means you do not get a share of the collective product. So when whole groups are not able to get jobs, they must find other ways of getting the goods that they need to survive. And we all know various ways that people do this.
So first capitalism has separated people from their need to provide everything for themselves. In doing so the capitalists alienate the worker from eir product, because it becomes the property of the capitalist. But those without jobs are also alienated from the whole production process. People often turn to the illegal service economy of selling drugs or sexual favors, or robbing and fencing stolen goods. Many also turn to the state for social services to get a distribution of the social product, without participating in production.
All of these solutions are even more alienating than working for the capitalists. Being a shoemaker or a baker are productive tasks that people can find pleasure in, even if they do not have a say in how the product of their labor is then distributed. Given the option, people generally don’t want to poison their community, deal with the threat of violence every day, sell their body, steal from people or even take handouts without being able to participate in producing. All of these endeavors require the individual to justify actions that they know are wrong, to dehumanize other people and themselves, and to just live under a lot of stress.
These activities, and the justifications that come with them, contribute to what then becomes the consciousness of this group of people excluded from the economy. Marx wrote about the alienation of the proletariat resulting from them not having a say in how the product of their labor is utilized. But there is a deeper level of alienation among the lumpen in that they must alienate themselves from other humyn beings, even those who are in similar situations to themselves. Capitalism promotes a dog-eat-dog mentality that is alienating for all people because we are encouraged to look out for ourselves and not trust others. But this is most pronounced for the lumpen, who are in turn demonized for their disregard for other people.
The demonization that the lumpen faces by the rest of society is one reason that none of these endeavors have futures. You can’t sell dope forever. You certainly can’t be a prostitute forever. Robbing and scamming is dangerous to say the least. And there are strong policies today to keep people from being on public assistance for too long. So there is a strong interest among the lumpen class to choose another path, one that addresses the alienation and lack of control they have over their own lives, including a limited ability to meet their own needs.
While we recognize that the leading force for revolution is the proletariat, our analysis clearly shows that the proletariat is virtually non-existent within U.$. borders, limited primarily to the small migrant worker population. The predominance of the labor aristocracy within imperialist countries today makes the lumpen a more important element than in times and places where the proletariat is the overwhelming majority. Just as Mao had to apply Marx’s analysis to Chinese conditions and understand the key role the peasantry plays in revolution in countries where that group is large, we must apply dialectical materialist analysis to the world today to understand the role that will be played by each significant class in Amerikan society.
The lumpen are a more important class in imperialist society today than in the past, and as a result we must identify those who fall in this group and analyze whether they are friends or enemies of the revolution. This essay attempts to identify the lumpen in the United $tates by looking at several potential indicators of economic and social position in society.
First World vs. Third World lumpen
The lumpen is defined as being excluded from the capitalist system; excluded from production and consumption. Of course, everyone must consume to survive, and the lumpen lives on as a class. But their consumption is outside the realm of capitalist relations. The lumpen must take from others what it needs to survive. And in an exploited country the lumpen takes from working people, the petty bourgeoisie and other lumpen who surround them. It is much harder and therefore more rare to take from the bourgeoisie, so the bourgeoisie doesn’t much care that the lumpen exist. The lumpen in the Third World is a parasite class, but primarily a parasite on the masses of the oppressed nations.
In the United $tates, we have no significant proletariat, so the lumpen class must be a parasite on the petty bourgeoisie. Historically that petty bourgeoisie has been white, while the lumpen have been concentrated in the New Afrikan ghettos, the reservations of First Nations, and the inner city oppressed communities in general. The national contradiction meant that the lumpen posed a threat to the stability of the country.
The history of social services in the United $tates comes from the Great Depression of the 1930s. As socialism and fascism were expanding to address the problems created by the anarchy of production, U.$. President Franklin Delano Roosevelt had to take drastic measures to preserve bourgeois democracy. The New Deal recovery program was that measure. It brought a system of social safety nets that live on to this day, though they were reformed and reduced starting in the 1980s with the Reagan administration.
This system allowed the emerging lumpen class to participate in the system of distribution and consumption without participating in production. They could do so in a way that was less precarious, less dangerous and better paying than their counterparts in the Third World. In addition to the federal government’s services, there is infrastructure in the First World to provide clean water and sanitation to people of all classes. There is rampant overconsumption and waste that makes acquiring basic needs like food and clothing a snap, and there is enough wealth in the country that many non-governmental organizations can fund their own programs to provide food and other materials and services to those in need. For all these reasons, the First World lumpen are a qualitatively different class than the Third World lumpen proletariat in that they do benefit from living in an imperialist country.
Some claiming Marxism tell us that those we call lumpen are really part of the proletariat; they are just part of the reserve army of labor that Marx talked about being necessary to keep wages down among the workers that were employed via competition. But as has been demonstrated, there is no significant proletariat in the United $tates (request our Labor Aristocracy study pack for more on this topic). And while there is a contradiction between employers and employees over wages, this has not been an antagonistic contradiction in post-WWII U.$.A.
To the extent that there is a proletariat in this country, they are migrant workers. And therefore the reserve army of labor is found south of the Rio Grande and elsewhere in the Third World.
The First World lumpen are the remnants of a long history of national oppression. The question that they face is whether the oppressor nation is willing and able to continue to integrate them into the Amerikan petty bourgeoisie, or if racism and economic crisis will lead to an increased lumpenization of the internal semi-colonies as Amerika pushes its problems off on them.
The white nation in North America has always been a predominately petty bourgeois nation. Therefore petty bourgeois class consciousness is overwhelmingly dominant among white people of all classes. Where there is potential for revolutionary white lumpen, it will be more common when in close proximity or integrated with oppressed nation lumpen. And these will be the exception to the rule. It is for this reason that we say the principal contradiction is nation in the United $tates, while spending much time discussing and addressing the lumpen class.
Therefore, in the analysis that follows, we will be defining the First World lumpen as a distinct class that is only evident in the United $tates within the oppressed nations.
Contemporary Class Analysis
In the last few decades we can already point to an expanding prison population, and the cutting of welfare roles, without an increase in employment, as some evidence to support lumpenization at the margins. As expected, this lumpenization has been disproportionately suffered by the oppressed nations. To the extent that whites have lost (or will lose) their class status, this concerns us as a likely trigger for growing fascist currents in Amerikkka, due to their historical consciousness as a settler nation and more recently as the most powerful nation on the planet. As we get into the numbers below, we’ll see that the white “lumpen” population could arguably outnumber that in the internal semi-colonies. But percentage-wise they are a smaller minority within their nation, and their national identity pulls them much more strongly towards fascism. For this reason, we will disregard poor whites in most of the analysis below. Of course there are exceptions to every rule. And in particular, among youth and where poor whites are more influenced by oppressed nation culture there could certainly be some splits in the white nation.While we have not seen a massive de-linking of the exploited populations, the internal contradictions of imperialism have brought significant economic downturns in recent years. In 2009 there was a steep rise in the percent of long-term unemployed (greater than 26 weeks), which has not yet declined significantly. It has hovered around 40 and 45% of all unemployed people; this is about double other high points dating back to 1960. [As of June 2016, over the 3 years since the original writing, this figure has declined to around 25%, which is still higher than the 17-18% rates that were normal before 2008.] While this could be a sign of a growing de-classed population, the U.$. economy is so rich that this unemployment has only resulted in modest increases in poverty rates.
Yet, even in the recent recession, government-defined poverty rates have not yet reached the levels they were at prior to 1965 when they were around 20%, give or take. In 2011 the poverty rate was recorded as 15%. Even this rate is inflated since assistance in the form of tax credits and food stamps is not counted as taxable income. If this income was included in their calculations it would pull 9.6 million people above the poverty line and bring the percent below the poverty rate to less than 12%.(1) So it is only a small group at the margins that may be seeing a shift in their material conditions such that they could arguably be seen as not largely benefiting from imperialism.
In order to paint a clearer picture of who is in the First World lumpen class, the following sections look at the empirical evidence both historically and today to figure out where to draw the line between lumpen and petty bourgeoisie within the United $tates. Above we defined the lumpen class as those who are excluded from the production and distribution of goods under capitalism. If you translate this into U.$. census statistics, this group would fall into those who are not participants in the civilian labor force.
Lumpen Defined by Employment Status
Employment is counted as working at least 1 hour of paid time, 15 hours of unpaid time in a family business, or being off of work (such as vacation or maternity leave) during the week referenced. The civilian labor force includes everyone defined as employed or unemployed (looking for work). Therefore the lumpen would be found in the group that is outside the civilian labor force. In the following graph we can see that this excluded group has grown in size only slightly since 1960, whereas the labor force has grown much more.
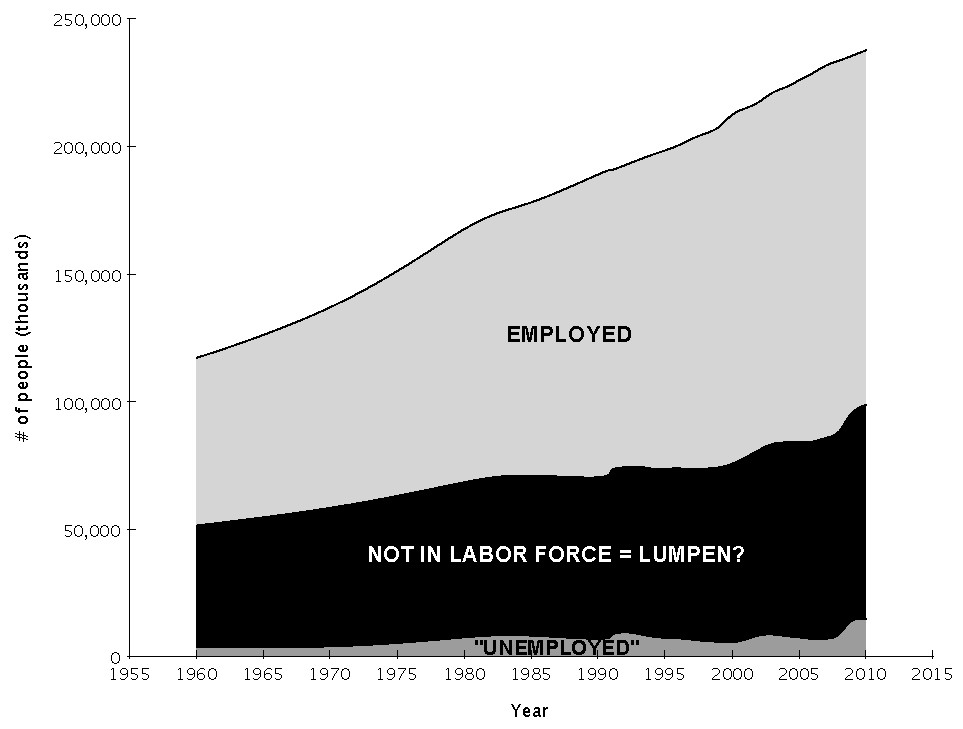
Not everyone in the middle group in this figure is part of what we would consider the lumpen. We have subtracted out housewives, students, and the elderly (detailed calculations for this subtraction are included in the full draft lumpen book).
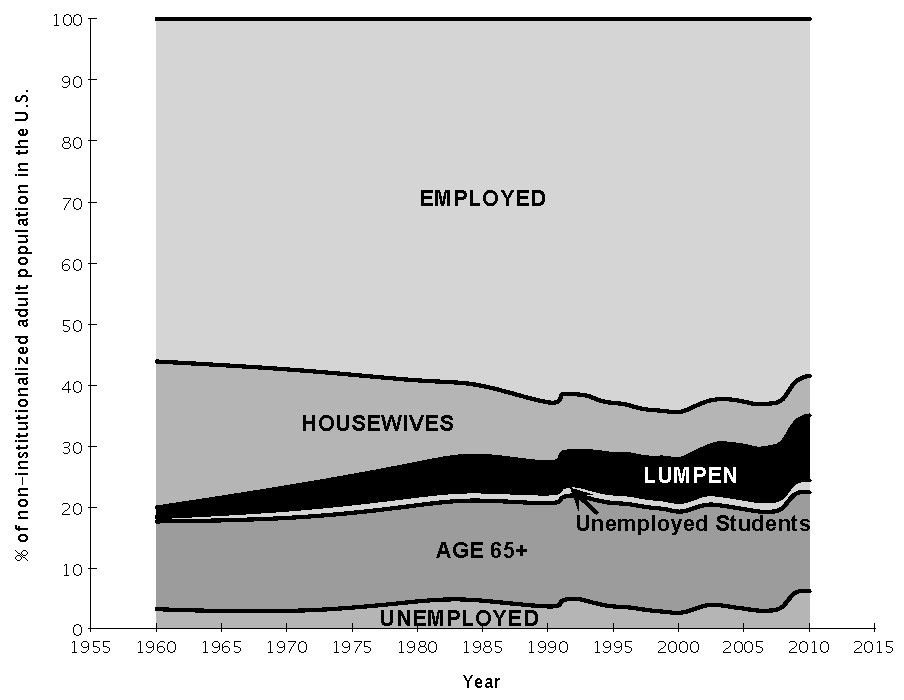
In this graph we see the biggest changes being the increase in the lumpen (from 1.5% in 1960 to 10.6% in 2010) and the decrease in the housewives category. While this is completely feasible, the direct relationship between these two groups in the way we did the calculation leaves us cautious in making any conclusions from this method alone. In order to confirm that our big picture estimate of the lumpen here is in the ball park we will look at this a couple of other ways, including trying to break down the lumpen via its constituent parts to see how they add up.
Also, keep in mind that we are concerned with the oppressed nation lumpen as a progressive force for national liberation struggles. The above method does not differentiate between nations, and we can assume that somewhere around half of that 10.6% is white Amerikans.
Gaps in employment rates between New Afrikan males and white males are quite large, and they have increased over the period of 1970-2010. Further, the unemployment rate does not include those in prison or those on public assistance programs. So when “unemployment” rates are reported as being twice as big as for New Afrikans compared to whites, this is an understatement because those rates are only calculated on the civilian labor force who is looking for work. Austan Goolsbee, former economic advisor to U.$. President Barack Obama has stated that since the mid-1980s “the government has cooked the books” on unemployment rates “because government programs, especially Social Security disability, have effectively been buying people off the unemployment rolls and reclassifying them as not ‘in the labor force.’”(3) This is a prime example of what we call the First World lumpen.
From this analysis of employment status we conclude that the 10.6% of the population that is unemployed and not housewives, students or elderly is principally lumpen. Conservatively we can assume that whites as 65% of the population are that same portion of the lumpen. This means that the oppressed nation lumpen defined by employment status constitutes about 10% of the oppressed nation population.
Lumpen Defined by Income
One thing that jumps out when looking at income data is the difference between individual income levels and household incomes. Some 39% of households had two or more income earners in 2010, so that over 20% of households made six figure incomes, while only 6.61% of individuals did.
Because individuals do tend to live in small group households, we will mostly look at that data below. Another thing that such an approach captures is the difficulties faced by many single-parent households. Single-parent households are the exception in that they do not benefit financially from having many members in their house because one earner must provide for many people. While this is very doable on a labor aristocracy wage, the demands of child-care and also keeping a job make it difficult for many single mothers who end up on public assistance. As a result there is a strong gendered component of the poor and lumpen that we will look at more below.
Before jumping into the numbers, let’s look at the definition of employed. While some in the unemployed group (defined as those who have been looking for work) may fall into the lumpen class, probably even more in the employed group do, seeing that you only have to get paid for one hour of labor per week to be considered employed. Those who are marginally employed, but are dependent on public assistance or the criminal underground to meet their needs, might reasonably be considered part of the First World lumpen class, especially in the context of the oppressed nation ghettos, barrios and reservations.
Here are some numbers to keep in mind as we look at income levels. A persyn working full-time for minimum wage will make at least $14,000 per year, depending on the state they work in. An estimate of average value produced per hour is between $3 and $5 based on global GDP and global workforce.(4) At that rate, working 40 hours a week year-round, one would produce almost $10,000 per year, which may be a good cut off point for saying whether a full-time worker is making more or less than the value of their labor.
From this we can assume that a person earning $14k or more is participating full time or nearly full time in the labor force. They are, therefore, not a candidate for the lumpen. Since wages for Amerikan citizens are all above the global average wage, any legally employed worker will be making more than the value of their labor. Those making less than $14,000 per year will be in 3 main categories: part-time employed youth, migrants making proletarian or semi-proletarian wages, or marginally employed people who depend on public assistance and other sources of income.
Around 30% of those with an income, and over age 15, were under the $15,000 per year mark in 2010, while 15% were under $10,000 per year.(5) This excludes people with no income, especially youth under working age who are a special case. But it includes people who are part of households with others who also have incomes. For example, a housewife who works one day a week for extra income and has a husband who makes $50,000 a year could be in this group. But this 15% gives us one more reference point to think about when estimating the First World lumpen.
Almost 50% of those earning at or below minimum wage are 16 to 24 years old, and 23% are just 16 to 19 years old.(6) This is a case where we would not necessarily see income defining class status. Most of these youth know that they are likely to make more money when they get older by looking at the adults around them. To eliminate the effect of these temporarily low-paid youth, who are still making more than the value of their labor, we will now look at household income and break it down by nationality.
Quintiles break up a population into five different equal-sized groups defined by a range, such as income level. Looking at the lowest quintiles of the population in terms of income is one way to tease out the size and composition of the lumpen. The average income of the lowest quintile is dramatically different between whites and New Afrikans/Latin@s with the poorest whites earning more than double the poorest New Afrikans/Latin@s.
| Race | Upper limit of lowest quintile | Avg income, lowest quintile |
|---|---|---|
| New Afrikan | $15,996 | $7,816 |
| white | $33,514 | $19,887 |
| “Hispanic” | $18,944 | $9,821 |
One problem with just looking at income in defining lumpen is that it may be a temporary state of someone being in a low income group. Youth definitely fall in this category. Some older folks who are retired, who are clearly not lumpen, also fall in this category. Among the 20-55 age group there are good reasons why some people have temporarily lower income but still are part of the labor aristocracy, such as short-term unemployment.
| Numbers in 1000s | Percent | |||||
|---|---|---|---|---|---|---|
| Income | white | New Afrikan | “Hispanic” | white | New Afrikan | “Hispanic” |
| Under $2,500 | 680 | 409 | 308 | 1.2 | 4.4 | 3.0 |
| $2,500 to $4,999 | 273 | 152 | 146 | 0.5 | 1.6 | 1.4 |
| $5,000 to $7,499 | 382 | 180 | 197 | 0.7 | 1.9 | 1.9 |
| $7,500 to $9,999 | 525 | 321 | 264 | 1.0 | 3.4 | 2.5 |
| $10,000 to $12,499 | 664 | 319 | 362 | 1.2 | 3.4 | 3.5 |
| $12,500 to $14,999 | 658 | 301 | 311 | 1.2 | 3.2 | 3.0 |
Clearly there are significant differences between single individuals earning $10,000 per year and a head of household with 4 children earning that same income. Looking at income by size of household gives us more detail on the total economic situation of a family. And we can use this data to calculate the maximum possible income per persyn for each group. This underscores the dramatic difference in financial situations faced by families based on the number of kids they have. We might use this data to create cut-offs for families whose kids are falling in the lumpen. While parents earning minimum wage and working close to full time are not part of the lumpen by definition, their income puts their kids basically outside of traditional economic financial participation and likely on the streets hustling for extra cash.
Again, the First World lumpen are not dying of starvation or water-born diseases that the Third World masses face. But they do suffer malnutrition, temporary states of lacking housing, water or electrical service, and exposure to environmental pollutants that most Amerikans do not have to deal with. And youth growing up in a family with a total income of less than $20,000 provides a standard of living relatively outside of the economic participation of the majority of Amerikans. An average of $5k per persyn per year in a family of 4 may provide for survival needs but nothing beyond that. In this country, youth who can not find a job to supplement their family’s income are likely to end up on the streets working outside of the traditional labor force, as a part of the lumpen. This data suggests that children of the lowest 15-20% of oppressed nation workers are good candidates for lumpen who may work their way out into the labor aristocracy as they get older.
Included in the calculations above are individuals making minimum wage or above at a full-time job, so we discard the two highest income categories for single people and, just to be conservative, the highest income level for 2 people. Using the rest of the categories to define either lumpen or migrant proletarian households, we get the following summary table.
| New Afrikan | white | Latin@ | |
|---|---|---|---|
| # of families | 3489 | 11,220 | 2596 |
| % of nation | 22% | 13% | 17% |
| % of nation <$10/family | 16% | 5% | 10% |
We do an additional calculation for only families making less than $10k per year, since one full-time worker making $10k would be making above our value of labor estimate. While at both levels, there are more white families than other nations, the rates are obviously higher for New Afrikans and Latin@s. The migrant proletariat population is of course much larger in the Latin@ category. So we could say that the New Afrikan lumpen defined by income is around 20% of the population, even though the maximum for the lowest quintile was given as $16,000/ year above. One report puts the migrant workers earning less than minimum wage in 2002 at 2 million people.(10) With some 80% of immigrants in the U.$. coming from Latin America and just 2.5 million Latin@ families in these low-wage categories above, it would seem that the Latin@ poor were dominated by working immigrant families and not lumpen. If true, this is one reason nation-specific parties are needed to lead the revolutionary movements in the different oppressed nations. The class content and interests of the lowest quintile of Latin@s and New Afrikans may look similar based on income level, but have very different relations to the means of production and to other nations.
Summing up the income data for defining the lumpen population, we can conservatively use the cut off of $10k/year for family income to say that 16% of New Afrikan families are lumpen and 10% of Latin@ families are lumpen or migrant proletarian. Further, youth in families earning less than $5k per persyn fall in the lumpen even though their parents are still working full time and are not part of the lumpen. That is the children of the lowest 10-15% of oppressed nation workers. So conservatively we can say between 15-20% of New Afrikan families are lumpen and between 10-15% of Raza are lumpen or migrant proletarian.
Lumpen defined by education level
There is a strong connection between educational background and what people end up earning financially later in life. There is a clear linear association between higher degrees attained and higher earnings. We do not care so much about the distinction between college graduates and those with advanced degrees, as this is the difference between levels of labor aristocracy, petty bourgeois and bourgeois income (all enemy classes). What is potentially interesting to a study of the lumpen in the United $tates is the population not even graduating from high school. Those without a high school degree earn significantly less than people who complete high school or college, and this group includes a much higher proportion of people who earn little to no money from legal employment. Therefore we look to educational attainment as a good candidate for a proxy to measure socioeconomic status in the United $tates.
Looking at educational achievement by nationality, we see that youth not getting a high school degree are disproportionately New Afrikan and Raza. Further, looking at unemployment rates for those without a high school diploma by nationality reveals interesting differences. New Afrikans who did not complete high school had a 22.5% unemployment rate compared with whites at 13.9% and Raza at 13.2%. The rate of employment among Raza probably reflects the large migrant population working low paying jobs such as farm workers, who are fully employed but earning very little.
As discussed above, while the unemployed may be part of the lumpen, this population includes some who are temporarily out of work but are actually participating in the workforce overall as part of the petty bourgeoisie. In addition, these statistics are only collected on people who are considered to be part of the labor force.
Combining income with education level reveals significant differences between whites and oppressed nations. However, the mean earnings for those without a high school diploma are not so low that we can lump everyone without a high school degree into the lumpen, even among oppressed nations.
| Gender | Race | Mean Income |
|---|---|---|
| Male | white | $22,353 |
| Female | white | $15,187 |
| Male | New Afrikan | $18,936 |
| Female | New Afrikan | $15,644 |
| Male | “Hispanic” | $21,588 |
| Female | “Hispanic” | $16,170 |
These numbers reinforce the theory that lack of a high school diploma in and of itself does not define the lumpen. There are plenty of people entering the ranks of the labor aristocracy without much education, pulling the average income for this group up into the labor aristocracy range. It appears that there is a split among high school dropouts where some are able to join the labor aristocracy and others are pulled down into the lumpen.
MIM has argued that youth are the most revolutionary group among the white nation because of their special status outside of the class to which they were born and because of the way that capitalist society puts youth in a position of disempowerment. A key to the labor aristocracy’s attitude as a class is the fact that individuals who may not be making much money at the moment can look around at their peers and see that they should anticipate improving their position. This is especially true for whites. Oppressed nation youth without a high school diploma, on the other hand, receive a mixed message. They look at their peers of their age group and see that they truly can not expect to get a job any time soon. On the other hand they can look at older folks around them and see a large percent having joined the labor aristocracy. This may result in a split in the oppressed nations by age where youth are part of the lumpen class for a period of time but eventually are pulled into the labor aristocracy by the wealth and decadence of imperialist society, even if they exist at the low end of the labor aristocracy. [See “Age as Gender: The Third Strand Shaping the Oppressed Nation Lumpen” in the draft lumpen book for more on this.]
The education analysis doesn’t give us a definitive calculation of the lumpen but we can conclude that a sizable portion of the group with no GED or high school degree is part of the lumpen, and this group is 15% of New Afrikans and 35.7% of Raza. These numbers will overlap with unemployment and family income numbers as many people will fall into all three groups.
What About First Nations?
The First Nation populations within the United $tates remain decimated from the history of settler genocide and continued oppression. As a result, the native people of this land, not including Chican@s, is less than 1% of the total population. An estimated one third of them live on reservations, totaling about 700,000 people.
Despite their decimation, First Nations tend to have a greater consciousness as nations separate from Amerika with rights to their own land, compared to the oppressed nations in the United $tates as a whole. And there remain concentrations of the indigenous population in certain regions that provide a base for significant resistance. On a number of these larger reservations, the percentage of families with incomes less than $3000 per persyn ranges between 15 and 25%. For New Afrikans as a whole that figure was 10%, though in regions such as south central Los Angeles it may be similar to First Nations.
Similarly, labor force participation rates on many of the larger reservations are lower than the average for other nations in the United $tates by as much as 23%. In San Carlos Indian Reservation 31% of people were receiving cash assistance in 2000, about 15 times the average for the country. About 34% received food stamps. Five of the ten largest reservations had almost a third of the population on food stamps and six had at least 15% receiving cash assistance.
One disadvantage that First Nations face on reservations is the lack of infrastructure benefits that virtually everyone else in the United $tates enjoys, which factors into our class position and perspective in this country. On reservations 14% of homes lack electricity, 18% lack adequate sewage, 18% lack complete kitchen facilities, and 20% lack indoor plumbing. These are unique conditions that First Nation vanguards must address that will not be of concern for the general U.$. population.
We present these numbers separately because the First Nation population is so much smaller than the other nations we focus on here, and because data on people living on reservations overall is not very complete.(12)
Groups within the Lumpen
Above we looked at employment status, education level and income to estimate the size of the lumpen class in the United $tates. A third approach is to look at the individual groups that make up the lumpen class as a whole. The main categories of people we will discuss below are the population that is imprisoned and under correctional supervision, the homeless, those dependent on public assistance and those involved in the underground economy.
1) Lumpen in prison and under correctional supervision
The imprisoned population is one segment of the lumpen that is excluded from the methods previously discussed since they are part of the “institutionalized population” in the U.S. Census data. For that reason, we might think that the above calculation underestimates the size, as well as the growth, of the lumpen class in the United $tates.
In 2011, there were 6.98 million adults under the supervision of the state via imprisonment, probation or parole, in the United $tates. This was 2.9% of the overall population, with just those in prison being slightly less than 1%. The overall percentage increased at a decreasing rate between 1980 and 2008.(13).
Focusing on the oppressed nations, over 3% of New Afrikan men are in prison. That number is about 1.3% for Latin@s, and less than 0.5% for whites. Rates for First Nations were not given in this report, but tend to be even higher than those for New Afrikans. If we extrapolate imprisonment statistics to all adults under supervision, we get about 8.7% of New Afrikan men and 3.8% of Raza men under some form of state supervision. With recidivism rates as high as they are, we are comfortable saying that those 1 million Raza men and 1.6 million New Afrikan men are part of the lumpen class. The same calculations put around 56,000 Raza wimmin and 73,000 New Afrikan wimmin in this group, plus a significant, but uncertain number of First Nation and Asian lumpen under state supervision. As a result, we suggest that 2.5 million is a safe estimate of those who’d fall in the group of imprisoned/formerly imprisoned lumpen, excluding whites. This would add less than one percentage point of the overall U.$. population to our total, but would include another 4.5% of New Afrikans and another 4% of Raza. Note that these numbers can’t be added to the totals from the unemployed or income-based lumpen groups above because those out of prison will overlap greatly with this group.
White men in this group number about 1.3 million, but are much more likely to find employment and join the labor aristocracy after release from prison. While in prison white men do fall into the lumpen class but lack the oppressed nation outlook and so often join white supremacist groups rather than supporting revolutionary organizing. This is just one factor contributing to a national outlook that leads us to exclude whites overall when discussing the revolutionary potential of the First World lumpen.
On any given day, nearly 23 percent of all young New Afrikan men ages 16 to 24 who have dropped out of high school are in jail, prison, or a juvenile justice institution in the United $tates.(14) So there is a significant overlap between those without a high school diploma and the prison population. This reinforces the lack of a high school degree as an indicator of the lumpen, but as we showed above, it’s not sufficient alone to identify the lumpen as plenty of labor aristocracy people come from this group as well.
2) Underground Economy
The underground economy parallels the legal economy, and has a parallel class structure. While the economy is capitalist and therefore dominated by bourgeois ideology, the majority of the people in this economy could be considered part of the First World lumpen in that they live at the margins, often with a parasitic relationship to the greater economy. While all communities have people who work “off the books,” just as they all have drug dealers, there is a qualitative difference between communities where that is the exception and where that is the rule.
We divide the underground economy into the following categories:
- illegal national bourgeoisie in drugs
- illegal labor aristocracy
- parasitic hustlers (thieves, scammers, pimps)
- illegal service workers (prostitutes, corner boys)
- small-time service workers (food prep, car repair, reselling)
Mao saw the national bourgeoisie as a class that can be an ally in the anti-imperialist war, but cannot liberate the nation itself. Due to the parasitic class nature of the internal semi-colonies in the United $tates today, we do not see the traditional Black and Brown bourgeoisie playing this role. Instead they are some hybrid of petty bourgeoisie and comprador bourgeoisie economically benefitting from the empire. Where we see a parallel to the national bourgeoisie of the exploited nations is among the marginally employed and illegally employed lumpen who rise within the illegal economy. Just as Mao’s national bourgeoisie was disadvantaged by imperialist control of their nation, it is the lumpen alone that is excluded from participating in the spoils of empire as the majority of oppressed nationals within U.$. borders do today. And when they do tap into those spoils through illegal enterprises, they remain in a precarious position.
The underground economy includes many small-time service workers who provide food preparation, car repair, vendor and small maintenance services in oppressed communities. The work performed is no different than any other service worker in the legal economy, but their work is usually irregular in such a way that they are part of an underclass that we consider close to the lumpen as they are excluded from the legal economy.
The illegal economy can be looked at separately from the service workers providing legal services off the books. The illegal economy is where we find those traditionally considered the lumpen. It would include the obviously-parasitic hustlers who rob, scam, fence and pimp. But the biggest sector of the illegal economy, and one of the most important sectors of the global economy, is the drug trade. The drug trade, while largely in the realm of the lumpen class, is successful enough to support a well-defined class structure of its own including a full-on bourgeoisie, a stable group earning what would be the equivalent of labor aristocracy wages, and a workforce that receives a more marginal income. The small-time drug dealers in oppressed communities could be grouped with the, largely female, sex workers as a group of illegal service workers who make incomes that are marginal in terms of global wage distribution.
Much of the illegal drug economy in the oppressed communities is carried out by lumpen organizations (LOs). These organizations historically were more dependent on extortion, and this still plays a large role in the economics of LOs. Extortion would be another example of clear parasitic relations of the lumpen with the rest of the community.
LOs are often formed along national lines, bringing with them a legacy or ideology of nationalism. Where these organizations are successful enough to create a bourgeoisie, or even an aspiring bourgeoisie, we see the basis for a national bourgeoisie in the internal semi-colonies.
3) Public Assistance Dependents
While 8% of the U.$. population receives some form of assistance from the U.S. Department of Health and Human Services, about 1.7% of the population receives more than half of their income that way. That translates to about 5.34 million people we could say are dependent on public assistance. Of those, about 3.25 million (61%) are not white and 2.13 million (40%) are New Afrikan.
Approximately 90% of U.$. citizens receiving cash assistance benefits are single mothers.(15) Just as the imprisoned lumpen is mostly men, the population on certain forms of public assistance is largely made up of wimmin with children, most of whom are actually white.(16)
4) Homeless
Up to 3.5 million people are homeless in the United $tates, about 1% of the population each year.
First Nations are overrepresented in the homeless population by a factor of 4, while New Afrikans are by a factor of 3.25. Youth under 18 are overrepresented by a factor of 1.65. Whites and Asians are underrepresented in the homeless population.
| nation | homeless pop | welfare pop | overall pop |
|---|---|---|---|
| white | 39% | 39% | 64% |
| New Afrikan | 42% | 40% | 13% |
| Latin@ | 13% | 16% | 15% |
| First Nation | 4% | 2% | 1% |
| Asian | 2% | 3% | 6% |
Conclusions
The table below sums up the conservative estimates we have made with regard to who constitutes the lumpen within U.$. borders. Our best total estimate for New Afrikans and Raza comes from the sum of the people identified based on family income and those actively in prison or jail. First Nations are calculated separately. All other methods of calculation are going to double count people we identified by family income and so can not be added to our totals.
| Non-Bourgeois Populations by National Groupings | ||||
| % Lumpen | # Lumpen | Semi-Proletariat | Non-Bourgeois Classes | |
|---|---|---|---|---|
| New Afrikan | 20% | 8,160,000 | 0 | 8,160,000 |
| Latin@ | 5% | 2,620,000 | 8,500,000 | 11,120,000 |
| First Nations | 30% | 700,000 | 0 | 700,000 |
| Total | - | 11,480,000 | 8,500,000 | 19,980,000 |
We conclude that conservatively we can count 20-25% of the New Afrikan nation as part of the lumpen. Among Raza we calculate between 15-20% as part of the lumpen or migrant proletarian.
To separate out the lumpen from the migrant proletariat among Raza we need to look at the number of migrant Raza in the United $tates. A Pew Hispanic Center 2005 report estimated 11.5 to 12 million total “illegal immigrants,” 56% from Mexico, and 22% from other Latin American countries. The U.S. Department of Homeland Security in 2009 estimated 10.7 million “illegal immigrants,” 62% from Mexico, and at least 15% from other Latin American countries. These numbers give us an estimate of between 8 and 9 million Latin American migrants in the United $tates. If the census accurately counts Latin American migrants, 17% of this population (based on 8,500,000 migrants) is not in the U.$. legally and most of that group would be migrant proletariat. That leaves a rather small group of lumpen. We can probably assume, however, that the census undercounts migrant workers because of both the transitory nature of the population and the fear around filling out government paperwork. Based on this reasonable assumption, we can perhaps estimate that the lumpen population among Raza is between 5-10% of the total population.
Given the volatility of the people who are still young and are excluded from the system economically and along national lines, the imperialists have no interest in an expanding lumpen class. And the only internal contradiction that would force an expanding lumpen class in the imperialist countries is extreme economic crisis.
As a baseline we can say conservatively that around 2010 the lumpen class represented about 20% of New Afrika, 5% of Raza and 30% of First Nations. This population represents about 4% of the overall population of the United $tates, and there is no strong evidence of the First World lumpen increasing in a significant way in recent years.
One example MIM had cited in support of the Panther theory of an expanding lumpen due to mechanization was the skyrocketing prison population centered around the 1990s, but spanning the time between the demise of the Panthers and today. While the numbers are staggering, this is still a tiny proportion of the oppressed nations. And rather than being the product of shifting economic conditions, we argue that they are primally a product of the open conflict between the white nation and oppressed nations in the United $tates via the white power structure of the state.
The police and prisons were the white nation’s stick and the economic opportunities and integration were the carrot presented to the oppressed immediately following the strong liberation movements of the 1960s/70s. Therefore, if we see oppressed nation prison populations shift into a downward trend, that would support the idea that the carrot is increasing in effectiveness in integrating them into Amerika.
The flip side of that is as long as oppressed nation prisoners keep increasing, we have strong evidence of an antagonistic contradiction along the lines of nation in the United $tates. Of course we have seen the trend level off a bit in recent years, ironically, largely in response to economic crisis. But it is too soon to say what that means.

